Lock-in Frequency Counter (Precision Frequency & Phase Deviation Measurement)
Overview
While a standard frequency counter captures "signal fluctuations" broadly, the Lock-in Frequency Counter compares the input signal with a reference signal (NCO: Numerically Controlled Oscillator) and visualizes the "deviation" with extremely high resolution.
It is suitable for observing the long-term stability (drift) of a clock source, wow and flutter in tape decks and record players, or minute frequency changes such as Doppler shifts. Recent estimation improvements also make the display more resistant to startup bias and better aligned with the actual elapsed sample time, which helps long-running measurements feel steadier and more trustworthy.
Operation
Preparation
-
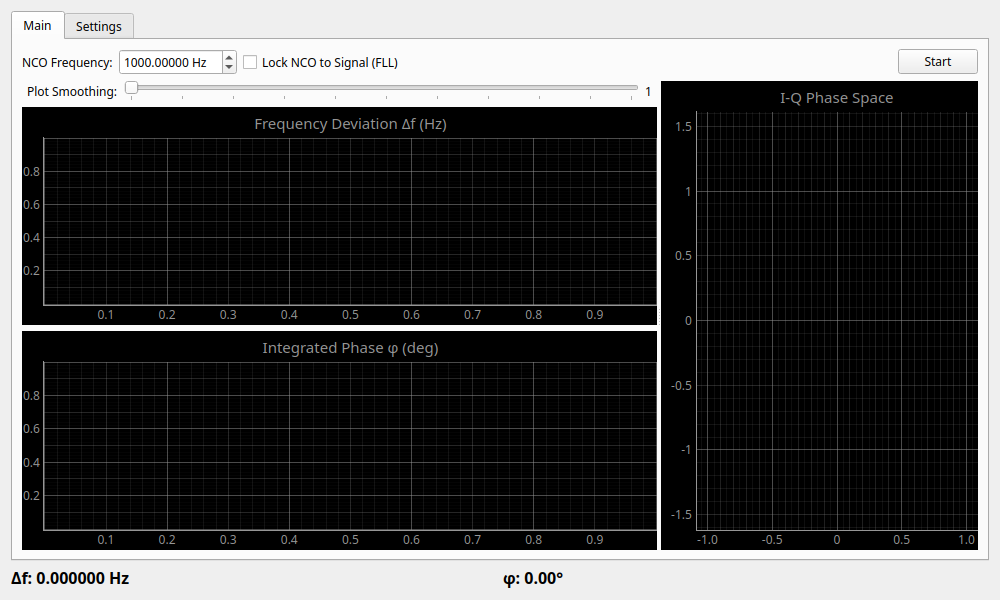
NCO Frequency: Sets the reference frequency (e.g., 1000 Hz).
Warning
The NCO Frequency represents the value of the internal software numeric oscillator and is unrelated to the device's physical output. Note that locking the NCO frequency merely means the measurement reference is tracking the input; it does not imply that all frequencies used by the audio device are locked to this reference.
- Reference Mode:
- Internal (NCO): Uses an internally generated ideal sine wave as the reference.
- Loopback (Ref Out): Uses the signal output from the device as the reference (FLL locking is disabled in this mode). Useful when measuring with physical cable loopback or internal loopback.
- Ref Output: Selects the physical output channel (Ch 1 / Ch 2) providing the reference signal in Loopback mode.
- Input Settings:
- Channel: Selects the input channel for measurement (Ch 1 / Ch 2).
- Gate Threshold: Stops measurement if the input level falls below this threshold (in dB). Used to prevent operation on noise.
- Press the Start button to begin measurement.
Reading the Graphs
- Frequency Deviation Δf (Hz): Displays the current deviation from the reference frequency.
- Smoothing: Use the slider to smooth the plot rendering. Moving it to the right increases averaging.
- Internally, the widget now tracks elapsed time from the actual number of processed samples, so the displayed deviation follows real audio timing more faithfully.
- Integrated Phase φ (deg): Displays the accumulated "phase change" resulting from the frequency deviation. Because the phase integration uses sample-based elapsed time, long observations are less likely to accumulate artificial drift caused by timing approximation.
- I-Q Phase Space (Right side): Provides a vector representation of "phase stability." When the points are concentrated at a single spot, the signal is stable. Movement in a circular pattern indicates a slight frequency deviation.
Distribution Tab
This tab visualizes the statistical distribution of the measured frequency deviations or time intervals over time.
- Distribution View: Select between Frequency Histogram (distribution of frequencies in Hz) and Time Interval Histogram (distribution of cycle times in seconds).
- Bins: Adjust the number of bins (granularity) of the histogram.
- Clear Distribution: Resets the collected distribution data.
- Distribution Statistics: Displays comprehensive statistics for the selected distribution mode, including Mean, Standard Deviation, Peak-to-Peak, RMS Jitter, Allan Deviation, Skewness, Kurtosis, Min, and Max values.
Settings
Statistics & Averaging
- Avg Count (KF-Q & Display): Sets the process noise (Q) for the Kalman Filter used in NCO frequency estimation, as well as the display averaging count. Increasing this value results in stronger smoothing (lower Q) and a more stable display.
- Display Uncertainty (σ): Displays the uncertainty (standard deviation) of the current frequency estimate. This indicates the confidence interval estimated by the Kalman Filter. Additionally, the decimal precision of the NCO Frequency setting automatically adjusts based on measurement stability (uncertainty), displaying up to 12 decimal places.
Note
The internal estimator uses a high-suppression periodic Blackman-Harris window and ignores a few startup estimates after capture begins. In practice, this reduces false phase rotation and the "first point jump" that can otherwise appear immediately after starting a measurement.
PID Control Loop
Adjusts the response characteristics of the FLL (Frequency Locked Loop).
- Proportional (Kp): Proportional gain. Sets how strongly to react to the current deviation.
- Integral (Ki): Integral gain. Reacts to the accumulation of past deviation to eliminate steady-state error.
- Derivative (Kd): Derivative gain. Reacts to the rate of change of the deviation to suppress overshoot.
Use Cases
- Checking Oscillator Stability of Reference Signals: Input a reference signal and observe how changes over time (e.g., thermal drift).
- Observing Wow and Flutter in Rotating Equipment: Play back a test signal (e.g., 3 kHz) and observe its frequency fluctuations on a time axis.