Oscilloscope
Overview
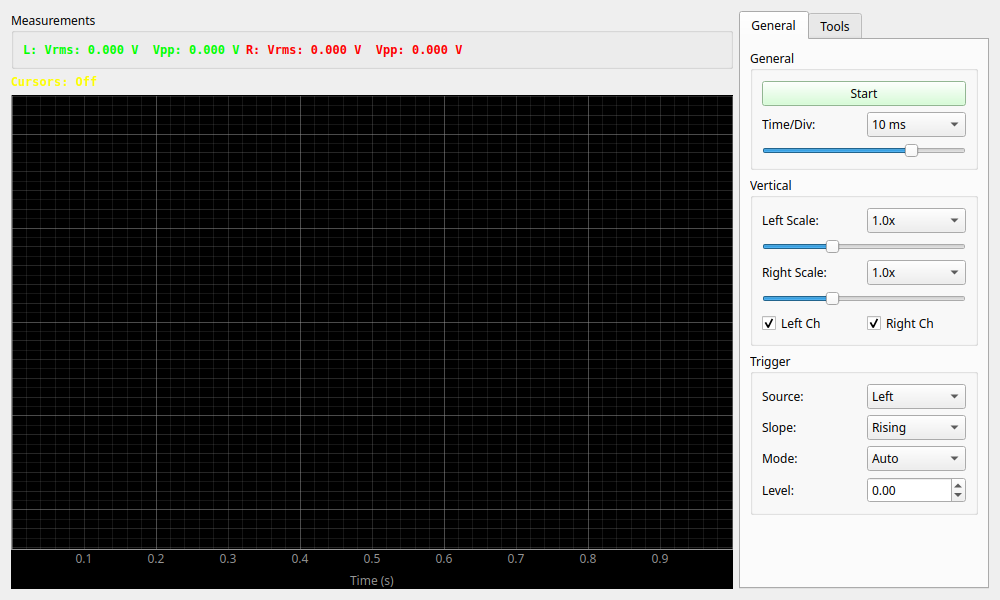
The Oscilloscope is a measurement tool that displays the waveform of the input signal on a time axis in real-time. It is used to visually confirm the shape, amplitude, and period of a signal. It also includes trigger functions, automatic measurement capabilities, and arithmetic (math) functions.
Compact Mode
When detached using the Detachable Wrapper, pressing the "Compact" button switches the widget to Compact Mode, maximizing only the waveform graph. This is useful when you want to hide the complex control panel and purely monitor the waveform.
Basic Operation
Starting and Stopping Measurement
- Start/Stop button: Toggles the measurement start and stop.
Reading the Screen
- Time/Div: Changes the scale of the time axis (horizontal axis). Larger values display a longer duration (slower changes), while smaller values zoom in to show a shorter duration (faster changes).
- 💡 Key Point: Even when displaying a long duration, the system continues to record the waveform internally at high resolution. Therefore, you don't have to worry about the waveform becoming 'choppy' or losing its trigger sync.
- Scale: Changes the scale of the voltage axis (vertical axis).
- Left Scale / Right Scale: Allows you to set the display magnification for each of the left and right channels. "1.0x" is the standard; setting it to a larger value, such as "2.0x", will vertically expand the display of the waveform.
- Channels: Check boxes can be used to toggle the display/hide status of each channel (Left/Right).
Trigger Settings
A function to stop (stabilize) the waveform for easier observation. By updating the screen the moment the signal crosses a specific voltage level (Level), the high-speed waveform appears frozen.
- Source: Selects the signal source for the trigger (Left or Right).
- Slope: Selects the direction in which the signal crosses the trigger level.
- Rising: Triggers when the voltage increases from low to high (rising edge).
- Falling: Triggers when the voltage decreases from high to low (falling edge).
- Mode:
- Auto: Updates the waveform at regular intervals even if the trigger conditions are not met (something is displayed even if no signal is found).
- Normal: Updates the waveform only when the trigger conditions are met (the screen stays frozen until a signal arrives).
- Single: Captures the waveform only once when the trigger conditions are met and then automatically stops (useful for observing one-time signals).
- Level: Sets the voltage level at which the trigger occurs.
Persistence Settings
A feature to display an "afterimage" of past waveforms on the screen. This makes it much easier to visually spot rare, abnormal noise or subtle waveform shaking (jitter) by observing how the light overlaps over time.
- Enable Persistence: Enables the persistence display.
- Decay: Adjusts the time until the afterimage disappears (decay rate). Moving it to the right makes it last longer.
- Intensity: Adjusts the brightness and density of the afterimage.
Tools and Measurements
Measurements
The current signal measurement values are displayed in the upper left of the screen.
- Vrms: Root mean square voltage.
- Vpp: Peak-to-Peak voltage (the difference between maximum and minimum values).
When "Enable Waveform Measurements" is checked, the following additional measurement values are also displayed (automatically calculated from the waveform shape).
- Freq: Frequency (displayed in Hz, kHz, etc.).
- Rise/Fall: Rise/Fall time (displayed in s, ms, us, ns).
Cursors
When "Enable Cursors" is checked, two cursors (C1, C2) are displayed on the screen. By dragging these cursors with the mouse, you can measure details such as the time difference (dT), frequency (1/dT), and voltage difference (dV) between two points.
Math Functions
Displays the results of calculations performed on two channels or signals as a "Math" waveform (white dotted line).
- Off: No calculation.
- A + B: Left + Right.
- A - B: Left - Right.
- A * B: Left × Right (product).
- A / B: Left / Right (quotient).
- Derivative: Differentiated waveform of the Left channel.
- Integral: Integrated waveform of the Left channel.
Filter
Applies a simple filter to the input signal for display. Convenient for checking noise, etc.
- Type: LPF (Low Pass), HPF (High Pass), BPF (Band Pass).
- Cutoff / Freq: Sets the cutoff frequency or passband of the filter.