Network Analyzer
Overview
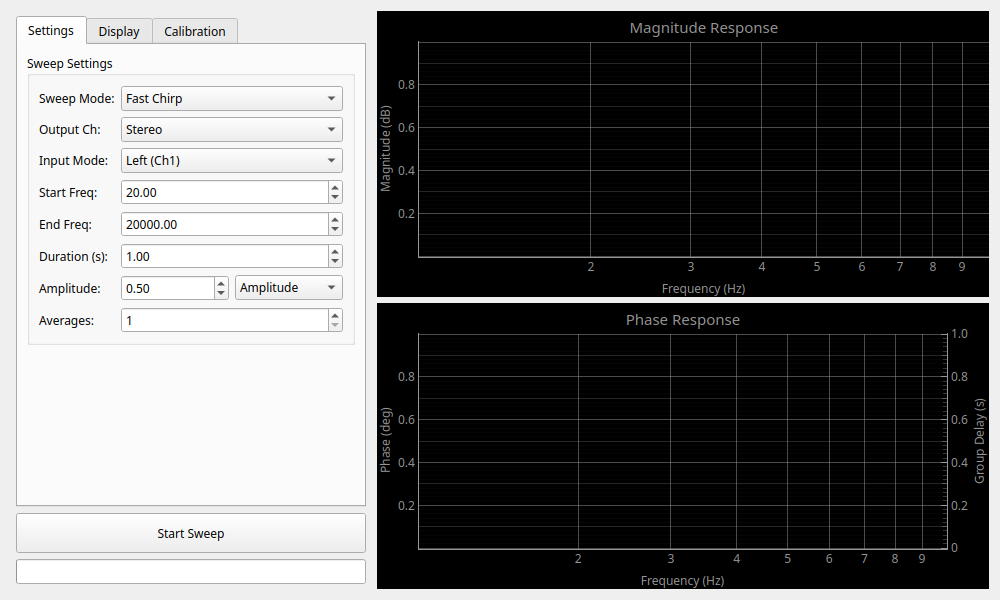
The Network Analyzer is a tool for measuring the "frequency response" (amplitude and phase characteristics) of equipment and systems. Simply put, it is a feature that graphs "how accurately (how loud or quiet) a device can transmit sounds of various pitches, from low to high."
It uses the "Fast Chirp" method (logarithmic chirp signal) to perform high-precision measurements of the entire band in a short time.
Primary uses:
- Measuring frequency response (f-response) of amplifiers and filters.
- Measuring characteristics of speakers and headphones.
- Measuring phase difference and delay between two signals.
☕ Coffee Break: Bat Sonar and the "Chirp" Signal
This widget uses a "Fast Chirp" signal, which rapidly sweeps from low to high frequencies. This is the same mechanism as the ultrasonic waves (echolocation) bats use to find obstacles. Because all frequency components are packed into a short duration, a single sweep allows for fast, noise-resistant measurement of the frequency response across the entire band.
Basic Operation
Starting Measurement
- Set the measurement range (Start/End Freq) and Amplitude in the "Settings" tab. The maximum frequency limit dynamically adjusts to the Nyquist frequency (half the sample rate) based on the current audio sample rate.
- Adjust the Duration of the chirp signal (Default: 10.0s). Longer durations generally improve the S/N ratio.
- Set the number of Averages. Multiple sweeps are performed and averaged to reduce noise.
- Click the "Start Sweep" button to begin measurement. Progress is shown on the progress bar.
- Click the button again to stop the measurement midway.
Routing and XFER Mode
Input/Output Settings
- Output Ch: Select the channel to output the measurement signal (L, R, or Stereo).
- Input Mode: Select where to receive the signal returning from the measurement target.
- Left (Ch1) / Right (Ch2): Measures the signal of the selected channel. In "Absolute (Level)" mode, it displays the input level in various units.
- XFER (Ref=L, Meas=R): Uses the Left channel as a "reference signal" (the original sound before entering the device) and the Right channel as a "measurement signal" (the sound after passing through), calculating the ratio of change (H = Meas / Ref). This powerful mode allows for measuring pure device characteristics by canceling out the inherent traits of the audio interface, showing strictly "how the device altered the sound" (relative measurement).
- XFER (Ref=R, Meas=L): Reverse transfer function mode using Right as reference.
- Crosstalk L -> R / R -> L: Pre-configured macros for measuring crosstalk between channels.
Display and Analysis
Customize the graph display in the "Display" tab.
Graph Types
- Magnitude Response: Displays gain (amplification factor) or absolute level for each frequency. Units can be selected from dBFS, dBV, dBu, Vrms, or Vpeak.
- Phase Response: Displays the phase shift for each frequency.
- Group Delay: Displays the delay time for each frequency, calculated from the slope of the phase (check "Show Group Delay").
- 💡 What is Group Delay?: Depending on the pitch (frequency) of the sound, the time it takes to travel through a device can slightly differ. For example, a phenomenon where "only the bass comes out slightly delayed." Group delay displays this "time shift per pitch" easily in seconds (or milliseconds).
- Coherence: Displays the correlation (reliability) between input and output (valid only in XFER and Crosstalk transfer modes). Values closer to 1.0 indicate high reliability. Low coherence suggests noise, distortion, or timing issues (check "Show Coherence").
- 💡 What is Coherence?: Imagine a friend talking to you in a noisy room. If you can hear their voice clearly, the "coherence is high" (reliable). But if the background noise is too loud, or if their voice is distorted, you won't be able to understand what they are saying. Coherence is like a "report card" that shows "how cleanly the input sound made it to the output"!
- ETC (Energy Time Curve): Displays how the energy of the impulse response decays over time (in the "ETC" tab).
- 💡 What is ETC?: Imagine plucking a heavy weight attached to a stiff spring; it bounces up and down for a long time. In the electrical world of filter circuits and amplifiers, how long a signal "lingers (ringing)" after a sudden input affects the crispness of the sound. ETC is a feature to observe "how quickly that energy vanishes".
- Impulse Response: Displays the impulse response of the measurement target in the time domain (in the "Impulse Response" tab).
- 💡 What is Impulse Response?: Imagine the sound of a handclap in front of a speaker. The impulse response is a waveform that captures how the system reacts to that instantaneous sound and how the ringing fades away. By looking at this, you can intuitively check things like the damping of a speaker cone or the reflections in a room on a time axis.
- Harmonics: Displays the harmonic components (2nd to 5th, and THD) of the measurement target for each frequency (in the "Harmonics" tab).
- 💡 Farina's Magic: Normally, measuring distortion across frequencies requires playing and measuring individual tones one by one. However, using the mathematical magic of the Farina method with "Chirp signals" and "Impulse responses", this analyzer can separate and extract the distortion for all frequencies simultaneously with just a single "Pweeeep!" sweep!
Display Options
- Smoothing: Smooths out fine jaggedness (noise) in the frequency response graph using fractional-octave smoothing. Selectable from None, 1/1, 1/3, 1/6, 1/12, or 1/24 Octave.
- Display as % (Harmonics Tab): Toggle the Y-axis of the Harmonics plot to display distortion levels as a percentage (%) relative to the fundamental, plotted on a logarithmic scale.
- ETC Smoothing: Smooths the noise in the ETC graph. Selectable from Off/Light/Medium/Heavy.
- Max/Min Freq: Limits the frequency range displayed on the graph.
- Single-Ch Mode: When using a single input channel, choose between Relative (Gain) (normalized to the output) or Absolute (Level).
Reference Curves (RIAA)
The Network Analyzer includes specialized support for RIAA curve comparison, which is essential for testing phono-equalizers.
- Show RIAA Curve: Overlays the standard RIAA playback curve on the magnitude plot.
- Enable IEC Amendment: Adds the IEC amendment (sub-sonic filter) to the RIAA curve. This adds a pole at 20.02 Hz (7950μs time constant) to the response.
- Alignment Mode:
- Auto (200Hz - 5kHz Fit): Automatically shifts the RIAA curve vertically to match the average level of your measurement between 200 Hz and 5 kHz. This is the recommended mode for quick evaluation.
- Manual: Allows you to manually adjust the Gain Offset of the reference curve for precise alignment.
Calibration
Latency and IR SNR
- Calibrate Latency: Measures the total input/output delay of the system. This is crucial for accurate phase measurement.
- IR SNR: Displays the Signal-to-Noise Ratio of the Impulse Response for the most recent sweep. Higher values indicate a cleaner measurement.
Reference Trace
Saves the current measurement result as a "reference" to compare with subsequent measurements.
- Store Reference: Saves the current graph as a reference.
- Apply Reference: Subtracts the saved reference from the current measurement result. Useful for checking relative changes or "flattening" a response.
Troubleshooting
- Audio stream failed to start. Check ASIO settings: This error message indicates that the audio stream failed to start. Please verify that the ASIO settings (Sample Rate and Block Size) match your audio interface's configuration.