LUFS & Level Meter
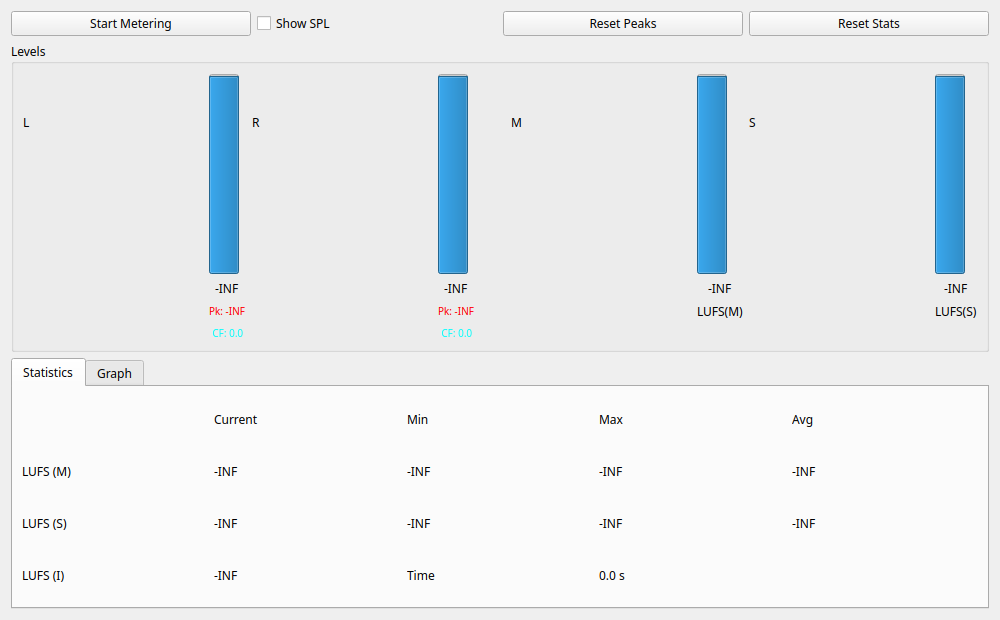
Overview
The LUFS Meter is a tool for measuring "Loudness" (the perceived volume by humans), which is the standard used in broadcasting and streaming services (YouTube, Spotify, Netflix, etc.). It uses an algorithm compliant with the international standard ITU-R BS.1770-4. It also simultaneously displays standard peak and RMS meters.
Key Indicators
LUFS (Loudness Units Full Scale)
The unit for perceived loudness.
- Momentary (M): Instantaneous loudness (400ms window). Used for checking sharp fluctuations in level.
- Short-term (S): Short-term loudness (3-second window). Suitable for understanding the recent loudness feel.
- Integrated (I): The overall average loudness from the start of measurement to the present. This is the most important indicator for evaluating the volume of an entire program or track. Gating is applied to exclude silent periods.
Other Indicators
- RMS: Root Mean Square value (electrical average level).
- True Peak (TP): An estimate of intersample peaks using continuous 4× FIR interpolation. It does not measure the physical DAC or speaker output.
- Peak (Pk): The maximum sample value of the signal.
- Crest Factor (CF): The difference between True Peak and RMS. It represents the width of the dynamic range.
Operation
Start Metering
Begins the measurement. Graph plotting and statistical calculations will start.
Reset Functions
- Reset Peaks: Resets the peak hold display on the level meter.
- Reset Stats: Resets LUFS statistics, peak holds, the peak histogram and event timeline, and latched acquisition anomalies. Filter history is cleared at the reset boundary. It also clears held results while stopped.
Target LUFS
Sets the target loudness level. This value affects the following areas:
- Statistics Tab: Used to calculate the difference from the Integrated LUFS (Target Offset).
- Level Meter: The color of the Integrated bar changes based on this target value (e.g., green near the target, red when exceeding).
- Graph Tab: The dashed reference line on the graph moves to this set value.
Show SPL
When checked, switches the units of the RMS level meter to "dB SPL" (requires prior SPL calibration in the Settings widget). LUFS values are always displayed on a dBFS basis (LUFS).
Graphs and Statistics
Statistics Tab
Provides a table of the current value (Current), minimum (Min), maximum (Max), and average (Avg) for each indicator.
M/S statistics are sampled every 100 ms of acquired audio, independently of screen refreshes. Only complete windows contribute: M starts after 400 ms and S after 3 seconds. Current readings use the available audio during this initial warm-up. Min/Max/Avg cover the session since Start Metering or Reset Stats; silence is excluded and --- means no finite observation yet. Avg is the arithmetic mean of these LUFS readings, not the gated energy average shown by Integrated LUFS. Reset Peaks leaves these statistics unchanged.
- Target Offset: Displays the difference between the set Target LUFS and the current Integrated LUFS. A "+" indicates it is louder than the target, while a "-" indicates it is quieter.
Graph Tab
Displays the latest 20 seconds of acquired Momentary (orange) and Short-term (blue) loudness, using the same 100 ms observations as the statistics. The time axis is relative to the latest acquired sample (0 s), not elapsed wall-clock time. No history is fabricated before the first complete window. Delayed screen updates recover the retained observations; repeated redraws do not add points. Stop Metering holds the history, and a new start or Reset Stats clears it. Invalid acquisition clears the graph and marks the statistics INVALID until reset or restart.
- Dashed line: A reference line indicating the set Target LUFS.
- Use this as a guide to check if the track or audio fits within your target loudness range.
Typical Target Levels
- TV Broadcasting: -23 LUFS (Integrated) / -24 LKFS
- YouTube: -14 LUFS
- Spotify: -14 LUFS
- CD / Club Music: -9 to -6 LUFS (Can be much higher due to the "loudness war")
True Peak measurement
True Peak uses continuous 4× FIR interpolation with ten input samples of delay. Filter history is preserved across callbacks and reset on acquisition discontinuities. This is an estimate, not a certified BS.1770 compliance measurement. An internal loopback observes the signal before output quantization and cannot certify physical DAC headroom.
Peak histogram and clipping profile
Set Peak threshold from −60 to +6 dBFS (default −1 dBFS). The threshold is inclusive: a magnitude equal to the threshold is counted. Use 0 dBFS to inspect full-scale hits, or a negative value to inspect a headroom margin. A threshold hit is a digital level observation, not proof of physical clipping.
- Peak histogram: Independent L/R True Peak distributions accumulated since the profile reset. Each input frame contributes once per channel, using the maximum of its four interpolated phases and its sample magnitude. Bins are 1 dB wide from −60 to +6 dBTP, with explicit underflow and overflow bins at the ends. Silence is included in the underflow bin. The default vertical axis is relative frequency [%]: each bin is divided by the total acquired frames for its channel. The Y axis starts at zero and automatically fits the highest bin across both channels, with headroom and rounded upper limits (up to 100%). It expands when the peak exceeds 90% of the current range and contracts only below 50%, preventing small fluctuations from continually changing the scale. Empty profiles use 0–5%. Collecting more of the same distribution does not change its shape or scale; the plotting area keeps its fixed margins. Empty channels display zero. Raw counters remain available for statistics.
- SP / TP frames: Per-channel counts of input frames at or above the configured threshold. SP uses the sample magnitude; TP uses the interpolated envelope. Mono is counted once as L, with R omitted from the profile. For inputs with more than two channels, only the first two are profiled.
- Longest SP / TP: Longest uninterrupted run above the threshold, including an ongoing run. Duration is the number of frames divided by the acquisition sample rate, displayed in milliseconds. Resolution is one input frame; this is not a duration measured on individual 4× subsamples. A below-threshold frame ends the run. No hysteresis or holdoff is applied.
- Peak events: Separate L/R sample-peak and True Peak lanes show threshold intervals against time since the profile reset. Circles identify SP and triangles identify TP. The event totals count interval starts, unlike the frame counts. FIR delay is compensated so both lanes refer to the source sample clock. Ongoing intervals and intervals cut by Stop or a data gap are partial observations.
Only the newest retained events are displayed (at most 512, including active intervals). The displayed eviction count explains missing older events; session totals and longest durations continue to accumulate. Histogram storage is fixed at 68 bins per channel. Evicting old timeline records does not invalidate the cumulative statistics.
The threshold-hit indication stays latched until a new profile is started. Stop Metering drains accepted profiling work and the ten source frames awaiting FIR delay, then holds the result; padding frames are not counted. Start Metering starts a fresh session. Reset Peaks only clears the level-meter hold, while Reset Stats clears the full measurement. Changing the peak threshold starts a new peak profile immediately, leaving integrated loudness intact; retained counts are never relabeled with a different threshold.
Acquisition gaps, invalid/non-finite input, channel or sample-rate changes, queue overflow, and processing failures latch an INCOMPLETE indication with the reason. Durations never bridge known gaps. Affected profile statistics are partial observations, not a complete measurement. Reset Stats or a new run clears the anomaly history; a continuing fault is detected again. After an acquisition-rate change, restart metering to use the new rate. The Statistics tab contains loudness metrics and total integration time. Profile status, per-channel exceedance counts, longest durations, acquired frame count/time, and retained/evicted event counts are grouped with the timeline in the Peak events tab.
The auxiliary Acquired readout shows the processed input-frame count and its duration (frames / acquisition sample rate), separately from the normalized distribution. It follows the profile reset and excludes padding and missing frames; it is not wall-clock time. Description panels reserve a fixed height, with internal vertical scrolling for longer text. Plot axes also reserve fixed margins, so changing counter digits, warning text, or tick labels cannot grow or shrink the drawing area. Resizing the window still resizes the plots normally.
Processing limits
Histogram and event aggregation run in a worker. The audio callback reuses the existing True Peak interpolation, copies data into a preallocated bounded mailbox, and never waits for worker/GUI locks. If reset/statistics work owns the acquisition lock, the callback skips that block and records a gap. The mailbox holds up to 32 blocks of at most 65,536 frames (64 MiB of reserved sample storage); overflow drops incoming profile data and preserves source-clock positions. Larger callbacks are rejected and marked incomplete. Unsafe magnitudes above 10¹² FS are rejected before squaring; ordinary peaks above 0 dBFS are preserved. These software bounds do not guarantee real-time performance on every device.