Goniometer
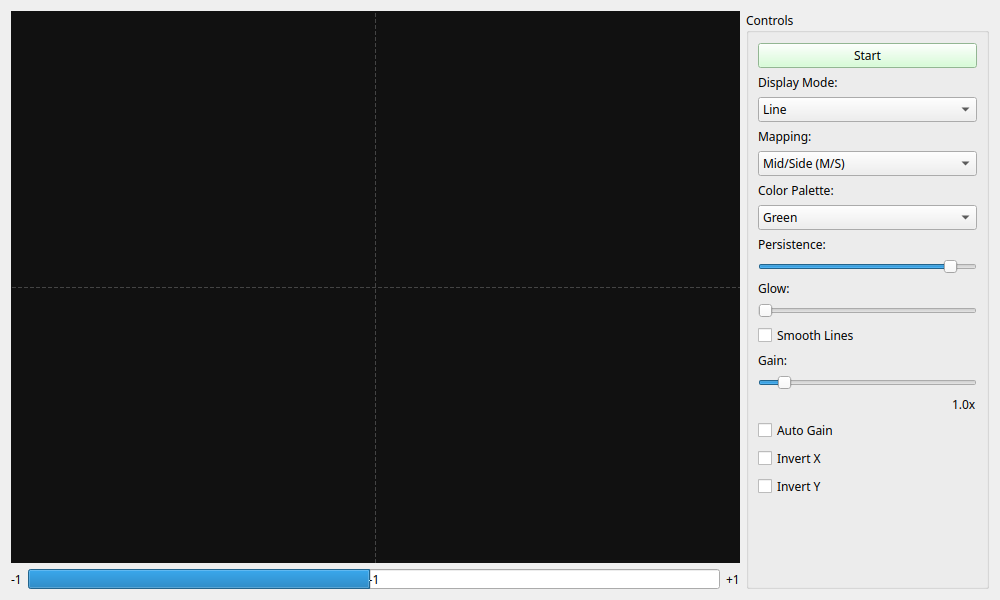
Overview
The Goniometer is a live meter that plots the left and right stereo inputs on an XY plane. Use it to monitor stereo spread, left/right bias, polarity inversion, and mono compatibility. It combines an XY display with a time-smoothed correlation coefficient from -1 to +1.
Correlation is not a single score for stereo quality. Sustained negative correlation can indicate cancellation when summed to mono, but the intended sound and listening result still matter.
Reading the XY Scope
Mid/Side (M/S)
This is the default mapping. Input samples are converted to display coordinates as follows:
- A narrow vertical shape means that L and R are similar and the mono component is strong.
- A horizontal shape indicates strong Side energy and warrants checking polarity and mono compatibility.
- The upper-left and upper-right directions represent Left-only and Right-only input.
- A tilted shape can indicate a level or phase difference between the channels.
The sum and difference are divided by two so that any input within ±1 FS fits the default display range. Raising Gain can still exceed that range; this is reported as Display out of range, separately from input clipping.
Left/Right (L/R)
This mapping assigns Left to the X axis and Right to the Y axis like an XY oscilloscope. An in-phase signal forms an ascending diagonal and an inverted signal forms a descending diagonal. Invert X/Y only changes the display orientation; it does not modify the captured samples.
Interpreting Shapes
A circle or ellipse represents an amplitude and phase relationship, but a circular shape is not inherently an "ideal stereo" or high-quality result. For a single sine wave, equal amplitudes with approximately 90° phase offset approach a circle. Complex audio combines frequency content, delay, reverberation, and panning into more intricate shapes.
Correlation Meter
Correlation is calculated from the left/right product normalized by the energy in each channel. It uses a 300 ms time response by default.
+1: Both channels have the same waveform and polarity.0: There is little linear correlation between the channels.-1: The channels have the same waveform with one polarity inverted.
The triangle is the current value. Short markers at the top and bottom show the recent three-second minimum and maximum. Use the Stereo Alignment Monitor for time history and more detailed stereo analysis.
The meter displays — and a reason instead of confusing an unavailable result with a valid zero when:
- Both channels are below -80 dBFS RMS.
- Only one channel is above the signal threshold.
- A mono input has been duplicated internally.
- Input clipping, an audio I/O error, NaN, or infinity is detected.
Basic Controls
- Start / Stop: Starts or stops audio acquisition. After Stop, the final value remains visible and is labeled as no longer live.
- Hold Display / Resume Display: Freezes only the display while acquisition continues.
- Clear: Resets Density, recent correlation minimum and maximum, and latched quality warnings.
- Mapping: Selects the M/S or L/R coordinate system.
- Gain: Applies only to the XY display. It does not affect input data or correlation.
- Auto Gain: Targets about 90% of the display range. It reduces gain immediately to prevent overflow and increases it slowly for a stable view.
- Correlation Response: Sets the correlation response from 50 to 2000 ms.
Appearance
- Points: Draws each sample as a point.
- Lines: Detects a short common period between stable channel signals and draws up to three recent gates with older gates dimmed. Ratios such as 2:1 and 3:2 use a gate long enough to close the figure, while small frequency offsets appear as moving contours. If no stable period can be detected, it automatically uses a short trail of up to 1024 recent samples.
- Density: Accumulates only newly captured samples into a phosphor-like density view.
- Persistence: Sets the Density decay time from 0.05 to 5.0 seconds. The decay is independent of display FPS.
- Glow: Applies display-only blur to Density mode.
- Color Palette: Selects Green, Fire, Ice, or Viridis, each with ordered luminance.
- Show Center Crosshair: Shows a crosshair intersecting the center of the display. It is on by default.
- Show Direction Guides: Shows the Mono, Anti-phase, Left, and Right direction guides. It is off by default.
- Show Axes: Shows numeric ticks and axis lines without coordinate-name labels. It is off by default.
- Show Grid: Shows the plot grid. It is on by default.
Quality Indications
Input clipping, audio I/O errors, and non-finite input are latched even if they occurred only briefly. They remain visible until Clear or the next Start.
Display skipped ... samples means that the GUI could not consume all Density samples before they left the display ring. It is distinct from an audio-device XRUN; Audio I/O error indicates a capture-level data loss.